Beyond CAC: The New E-Commerce Strategy Metrics Redefining Brand Health

Beyond CAC: The New E-Commerce Strategy Metrics Redefining Brand Health

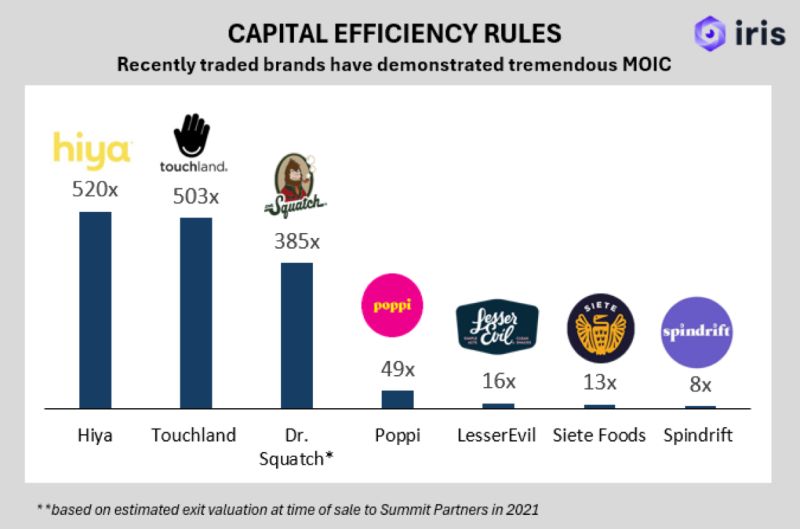
In 2025, DTC operators aren’t bragging about CAC (Customer Acquisition Cost) anymore. They’re talking TER, MER, and payback windows.

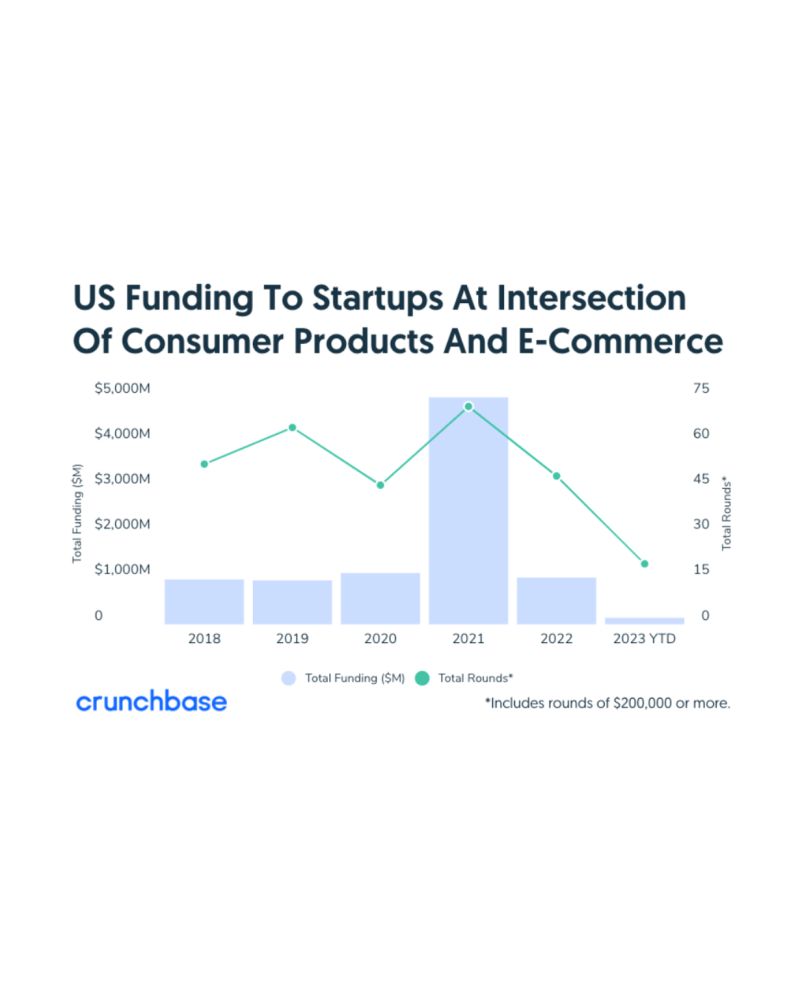
With funding tightening and e-commerce growth cooling, Shopify brands are being held to a new standard: capital efficiency. You’re not judged on how fast you grow—but how well you do it.

“If you’re starting in ecom, you better be thinking about profit from DAY ONE. Not some mythical LTV that’ll save you in year three.”
Operators

Welcome to the era of smarter, leaner metrics.

TER: The $1-to-Revenue Test Investors Are Obsessed With

Traction Efficiency Ratio (TER) = LTM net revenue ÷ total equity raised.

Coined by investor Kiva Dickinson, TER tells you how much real revenue a brand has generated per dollar of outside capital. According to Dickinson:

  • A TER above 2.0x is strong for brands doing $1M–$15M in revenue
  • The best consumer startups hit 5–10x TER at Series A
  • A TER under 1.0? That’s a red flag—it means you’ve raised more than you’ve earned

TER is the BS detector for CPG investing. It bakes in growth, margin, and burn discipline into one number. And because it reflects capital efficiency, it tells investors how much future dilution may—or may not—be needed to hit scale.

If I could only know one number before making a CPG investment, it wouldn’t be sales, margin, or even growth | Kiva Dickinson
If I could only know one number before making a CPG investment, it wouldn’t be sales, margin, or even growth I’d want to know something I call the Traction Efficiency Ratio (TER) TER is calculated by dividing a company’s last twelve months (LTM) net revenue by the total equity capital invested to date — a simple proxy is total dollars raised For example: – Company A: $5M in revenue ÷ $5M raised = TER of 1.0x – Company B: $2M in revenue ÷ $1M raised = TER of 2.0x Generally, for companies doing between $1M and $15M in revenue, we look for a TER above 2.0x — but some of our best deals were at 5–10x when we invested So why does this metric matter 1. Proxy for ROIC: Return on invested capital (ROIC) is the metric most closely correlated with stock performance and company value in the public markets It reflects the quality of a company’s cash flow engine and unit economics 2. Correlated with Revenue, Growth & Margin: If revenue is low, it won’t overcome startup costs in the denominator to drive TER If growth is slow, too many years of expenses and burn will weigh down TER If margins are poor, too much capital will be needed, and the denominator will weigh down even attractive revenue in the TER ratio 3. Indicative of Future Dilution: The less capital a company has needed to approach exit velocity, the less it will likely need to reach the finish line That means less future dilution — and the same return at a lower, more conservative exit valuation 4. Signal for Exit: The recent run of exits in CPG have all had high ratios of exit value to total capital raised (shoutout to Drew F. / Iris Finance for the chart below) This ratio closely tracks TER — just divide it by the typical 3–5x revenue multiple at exit Companies with high TER at exit likely had high TER at Series A — a good way of reverse engineering your outcome Thankfully, we rarely have to rely on just one metric But even with a full picture, we often find ourselves coming back to this one: TER | 47 comments on LinkedIn

MER: Marketing ROI Without Attribution Games

Marketing Efficiency Ratio (MER) = Total revenue ÷ Total marketing spend

Unlike ROAS, MER looks at blended performance. It tells you if your ad dollars are turning into revenue, regardless of channel.

  • Healthy MER range for DTC brands: 1.5x–4.0x (Prescient AI)
  • Target MER of ~3x is common—spending ~33% of revenue on paid
  • A MER >5x may suggest under-investment in growth
  • A MER <2x means your ad spend is eating too much of your revenue

But MER isn’t a throttle—it’s a dashboard. As Taylor Holiday warns:

“Running your business to hit a rigid MER can literally suffocate your growth.”
Running your business with a MER (marketing efficiency ratio) or ACOS (average cost of sale) constraint is literally suffocating your growth. | Taylor Holiday
Running your business with a MER (marketing efficiency ratio) or ACOS (average cost of sale) constraint is literally suffocating your growth. It throttles new customer revenue growth because as paid revenue increases as a % of total revenue it makes those metrics worse. | 14 comments on LinkedIn

Smart operators flex spend when MER climbs and tighten when it dips. It’s not about perfection—it’s about balance.

LTV:CAC and Payback: The Speed of Profit Matters

LTV:CAC has long been a DTC staple. But now, it’s not just about the ratio—it’s about how fast you earn it back.

  • A 3:1 LTV:CAC ratio is still a baseline
  • A CAC payback window under 6 months is now considered excellent (Saras Analytics)
  • Anything over 12 months? Investors are asking hard questions

You can’t rely on hypothetical LTV years out. You need real retention and repeat revenue to prove it. Vuori, for example, hit a ~4:1 LTV:CAC and remained profitable while scaling (ClickZ).

“Not some mythical LTV that’ll save you in year three.”
— Ridge Wallet CEO via Operators

This shift is forcing brands to rethink how they recover CAC—starting with first-order profitability. One of the most overlooked leaks in the funnel? Abandoned checkouts.

That’s where tools like LiveRecover earn their keep.

Instead of retargeting these customers through another paid channel, LiveRecover deploys real humans to follow up via SMS—turning what would’ve been lost revenue into a recovered order with no additional CAC. It’s not just a nice-to-have recovery tool—it’s a first-order margin booster, a payback window shortener, and a rare example of post-click conversion support that actually improves financial metrics your CFO (and your board) cares about.

What Does “Good” Look Like in 2025?

Benchmarks:

MetricHealthy RangeNotes
TER>2.0xTop brands hit 5–10x
MER1.5x–4.0x3x is solid; <2x = dangerous
LTV:CAC≥3:14–5:1 = elite
Payback<6 months<3 months = rocket fuel

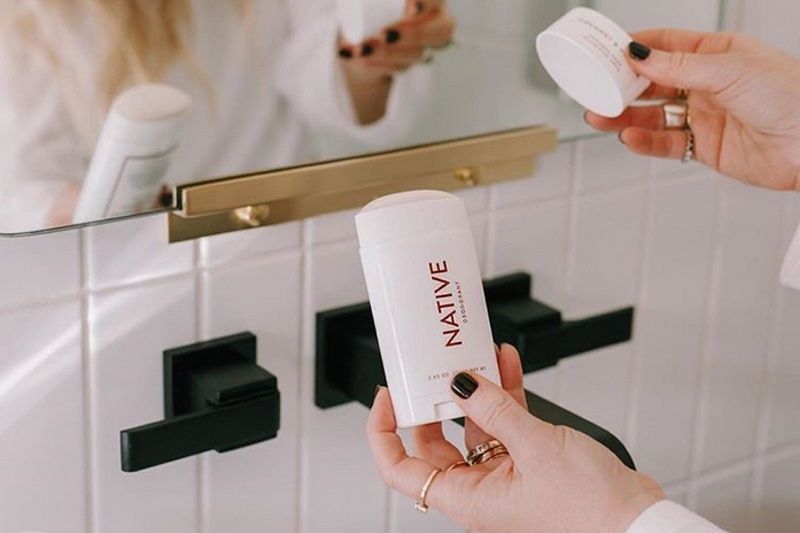
High-efficiency brands—like Native Deodorant ($30M on $500K raised, per Codie Sanchez)—prove that you don’t need mega funding to scale. Just margins, scrappiness, and a sharp eye on unit economics.

Ever heard of Native deodorant? | Codie A. Sanchez
Ever heard of Native deodorant? Their story&#39;s wild: • Exited for $100M • Within 2.5 years What&#39;s even crazier: • They ONLY raised $500k total It&#39;s the kind of biz that inspires you to just START something... Here&#39;s the story: Moiz Ali got the idea for Native after reading the back of an Axe can. He had no clue what the ingredients were. At the time, he knew &quot;natural&quot; products were on the rise (natural deodorant was the number 1 product on Etsy in 2015). And so... He decided to start a natural deodorant company. Bear in mind - at this point, Moiz knows NOTHING about deodorant. His reaction is one of the reasons I love this story – it shows how important mindset is in business: “I know nothing, and in six months, I’m going to become one of the world’s leading experts on deodorant. I’m just going to spend my time learning, and I’m going to figure it out.” So - how did Moiz make the first bar of Native? He went on Etsy, found the best makers of natural deodorant &amp; asked to white label their product. And as is often the case, it took dozens of no&#39;s before one person agreed. At this point, Moiz launched on Product Hunt. With no deodorant in hand, he sold his first 60 units. That&#39;s when he ACTUALLY put in the first order. This is a theme in business success stories: lowering risk by testing the market before committing. Worst possible case? He&#39;s in the hole a couple hundred $. Another thing Moiz did right? Hyper-focus on customers. Despite early traction, he quickly realized the first product wasn&#39;t great. So he spent the first year fine-tuning the product – by sending out free samples &amp; iterating on feedback. The results? Native went from a 4-star rating &amp; 25% repeat order rate to a 4.7 rating &amp; 50% repeat order rate. Moiz scaled the biz from $50k revenue in Jan 2016 to $1M in Nov of the same year. Other ways they grew so fast: • Launching subscription plans • Customer video testimonials as ads • Upgrading customer experience (sending fun emails &amp; cards with purchases) In 2017, Native had hit between $25-35M in revenue – with ONLY 8 fulltime employees. They were acquired by P&amp;G for $100M. This was the first purchase P&amp;G had made in 10 years. Moiz says there were 4 main reasons he went with P&amp;G: • Value alignment during negotiation (no over-the-top diligence requests &amp; respecting Moiz&#39;s vision) • The dedication P&amp;G showed in their work • Alignment on brand &amp; creative • Resources for future growth I&#39;m inspired by this story: • Moiz knowing nothing but picking a simple biz model • His obsession with customers • How insanely fast they grew • The care behind the exit It makes you think... &quot;I could make it if I just took the leap.&quot; ↓ If you enjoyed this story, feel free to repost &amp; follow for more. | 173 comments on LinkedIn

What’s New: Runway, Burn Multiple, and CM2

Operators are adding new metrics to the stack:

  • Profitability runway: Months of cash until break-even
  • Burn Multiple: Cash burned ÷ net new revenue (lower = better) (Haason SaaS)
  • CM2: Contribution margin after marketing spend

Also on the rise: tracking repeat purchase rates, subscription retention, and cohort-specific LTV.

The vibe shift? Operators are talking about sustainability over scale. As Sam Ross noted:

“It’s not just: how fast are you growing? It’s: how long can you keep it up?”
Over the weekend, I chatted with a relatively early DTC founder. | Sam Ross
Over the weekend, I chatted with a relatively early DTC founder. She asked me about the venture path and if it was worth exploring. My honest answer is probably not, and that is assuming that you can even get it. It is tough out there for DTC brands. It is even tougher for DTC brands trying to raise venture capital. According to Crunchbase, funding is down 97% for companies at the intersection of e-commerce and consumer products. Did the market get a little carried away in 2021… yea. Will things bounce back, possibly / probably? But the truth is that the venture path really only makes sense for a small number of DTC brands. Most DTC brands really aren’t suited for venture-style outcomes, expectations, and growth rates. And that is OK! You can build a killer DTC business without venture.

Case Study Contrast: TER Heroes vs. VC Burnouts

The cautionary tales:

  • Casper: negative gross margins, IPO flop
  • Allbirds: $4.1B → $300M
  • Pura Vida: bought for $75M, sold for $1M (Operators)

These brands scaled hard—without the economics to back it up.

The high-efficiency heroes:

  • Vuori: Profitable, raised $125M after proving traction
  • Chomps: Bootstrapped, then raised growth capital
  • Native: $100M exit after scaling on almost no funding

The common thread? High TER. Tight CAC paybacks. Real margins.

The Real Story in Boardrooms Now

DTC operators in 2025 aren’t flexing revenue anymore. They’re flexing:

  • MER snapshots
  • TER charts
  • 60-day repurchase curves
  • CAC payback by channel

The new playbook is clear: Efficient growth > flashy growth. If you want to raise, expand, or exit—you need the metrics to back it up.

“You need at least 65 gross points to survive. If you don’t have that, you’re on borrowed time.”
Operators

Profit isn’t optional. It’s the plan.

Subscribe for weekly DTC insights.

0:00
/0:05

Read more

Commerce Roundtable San Diego - The Best DTC Event of the Year